The Zoo
Zoo of Mathematics
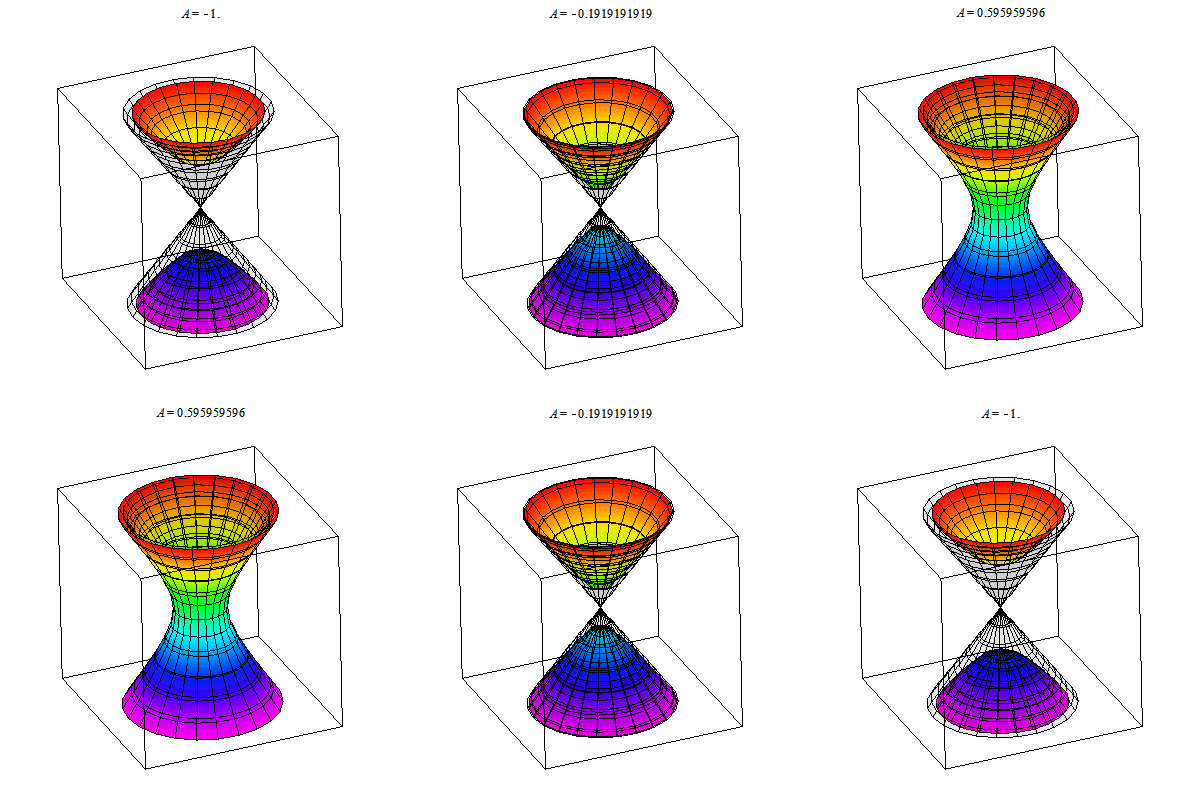
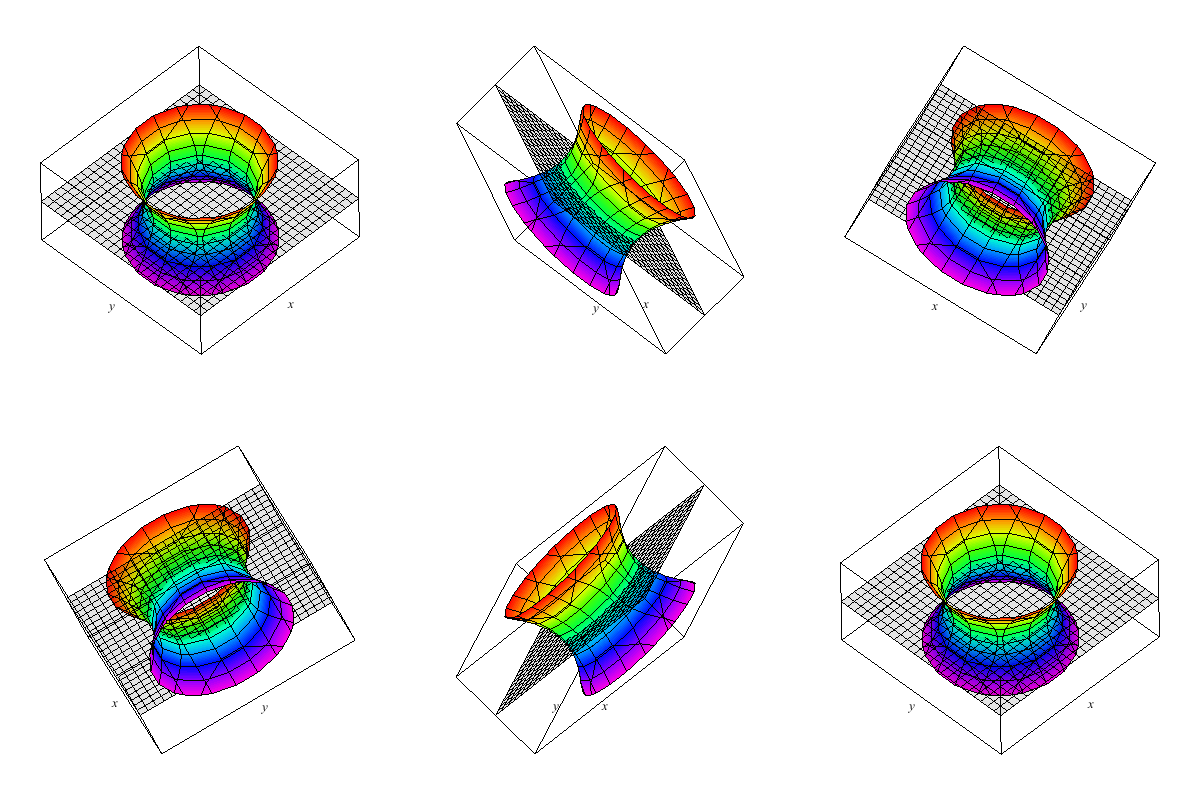
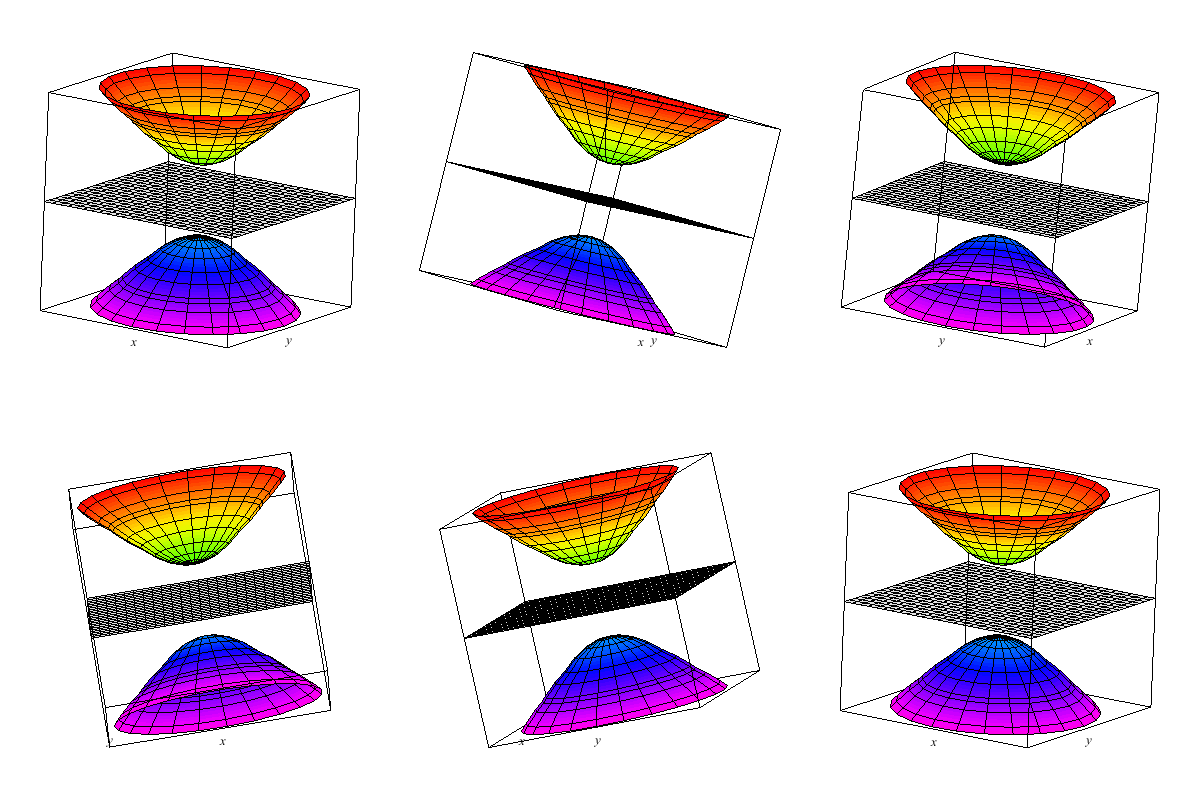
I show below the cone as well as associated hyperboloids of one or two sheets. These are all solutions to xx+yy-zz=A. You can see that when A>0 there is one sheet whereas when A<0 there are two sheets. In the middle A=0 gives the cone.
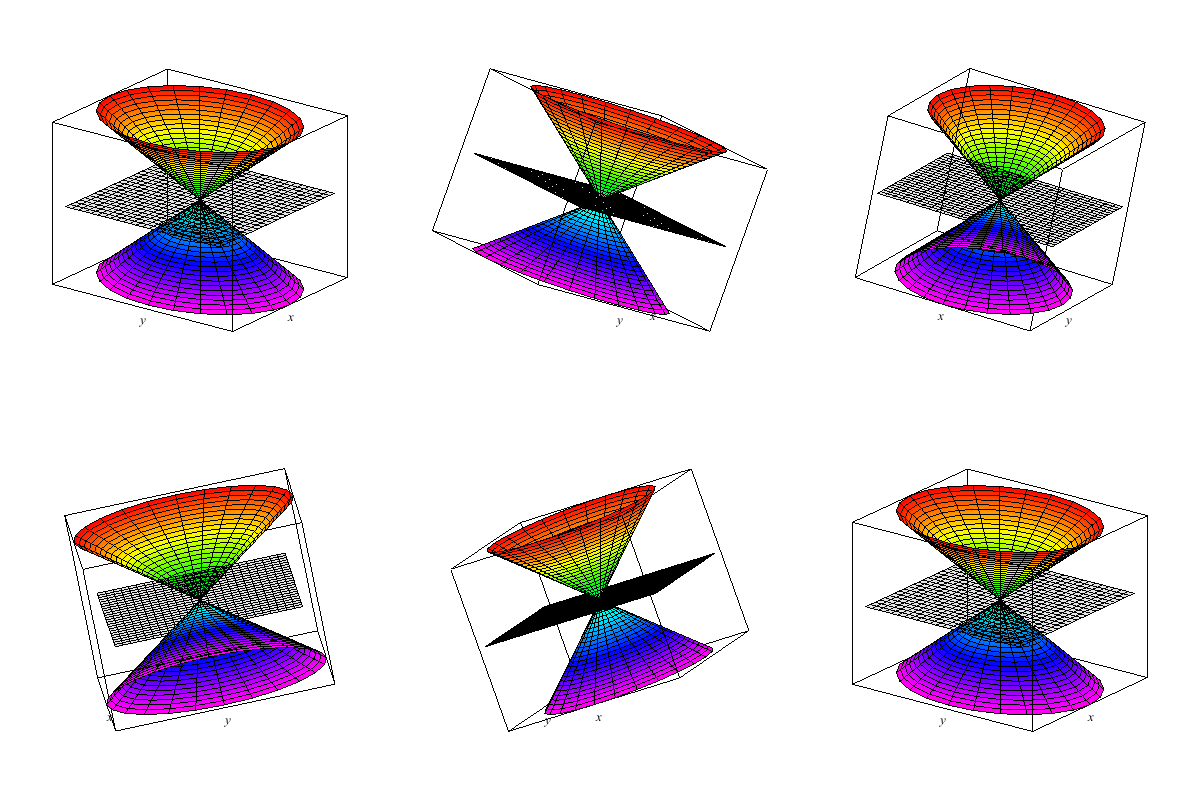
This is an elliptical cone.
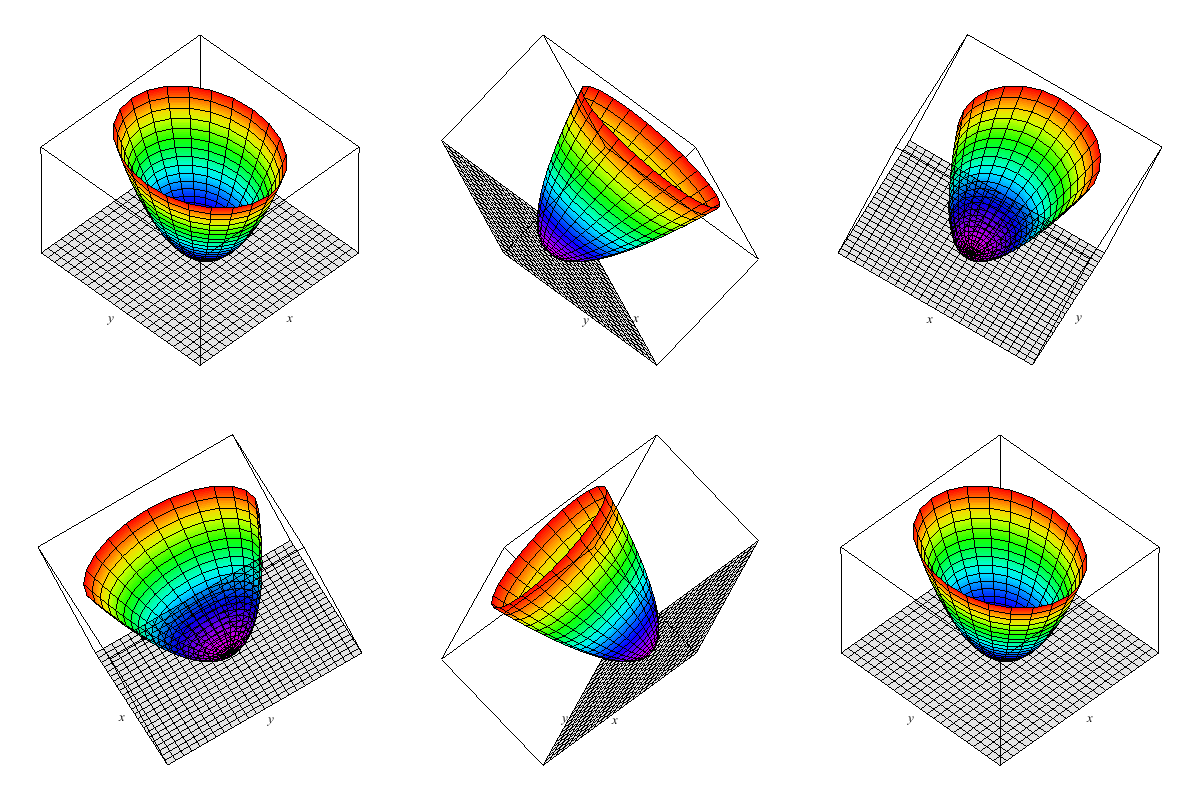
This is an elliptic paraboloid.
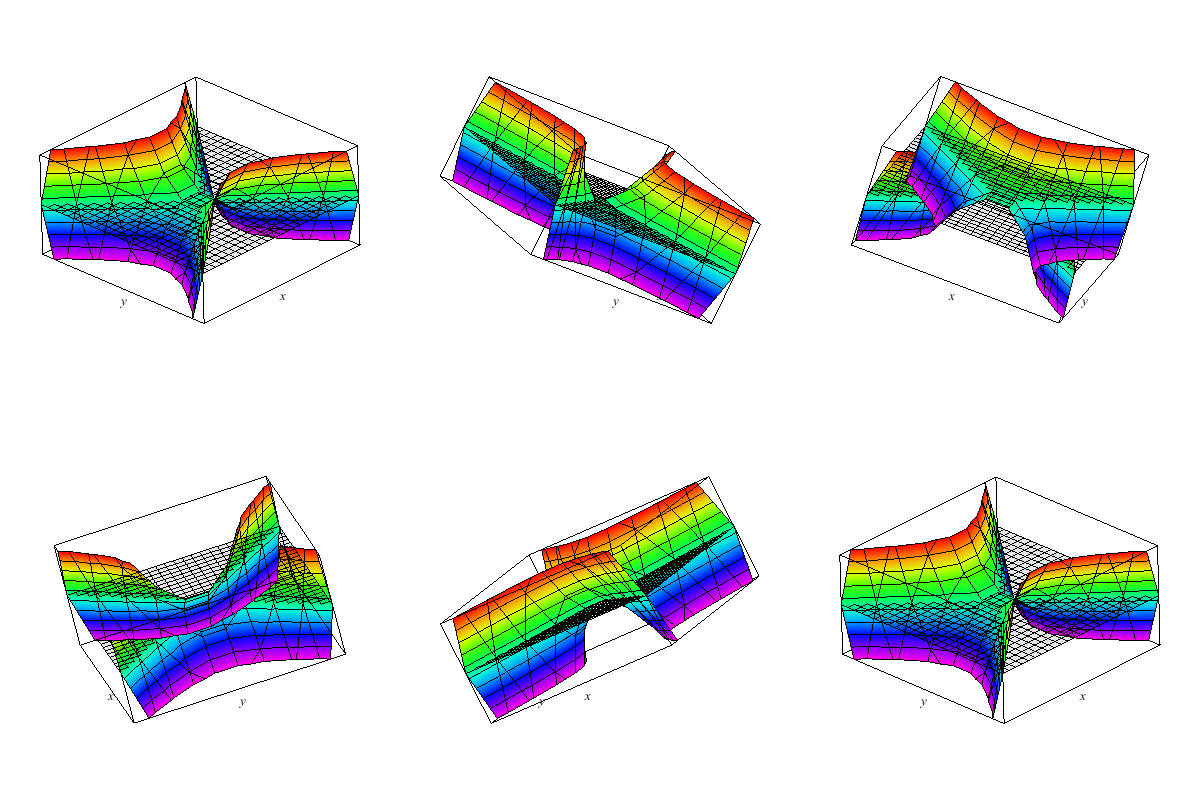
This is a hyperbolic paraboloid.
This is a hyperboloid of one sheet.
This is a hyperboloid of two sheets.
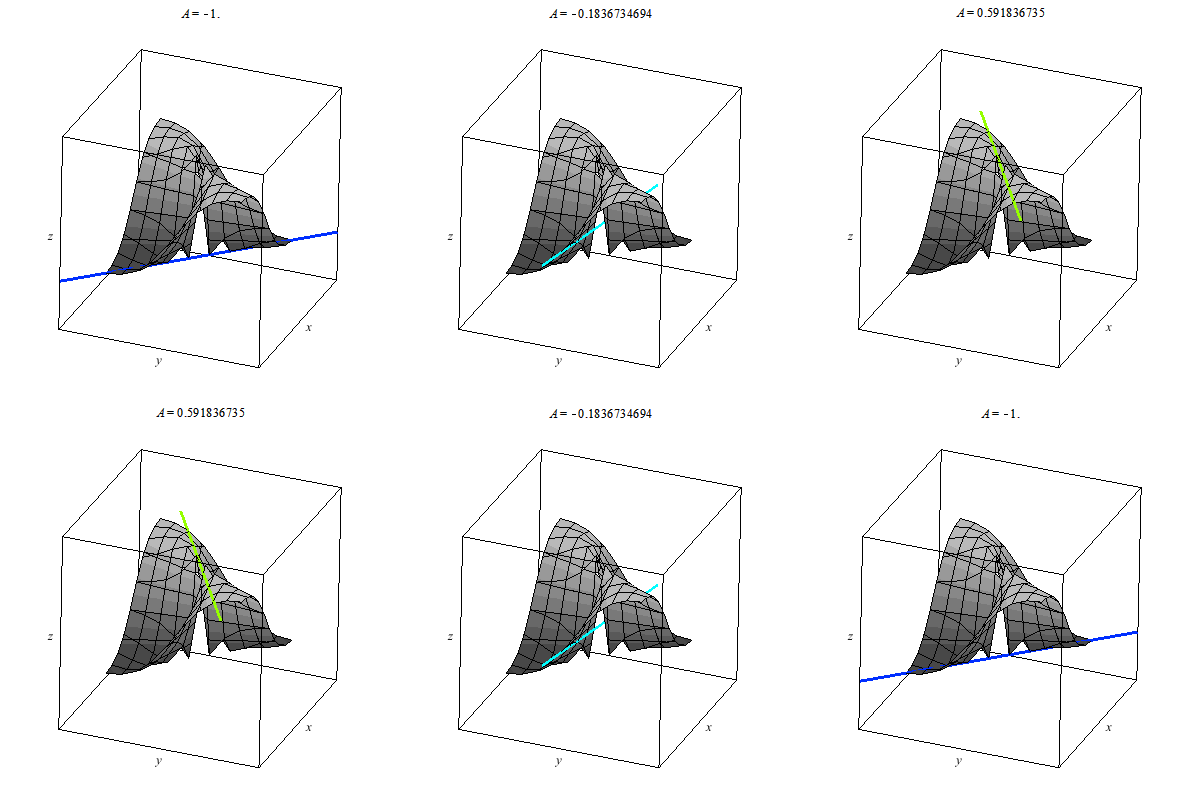
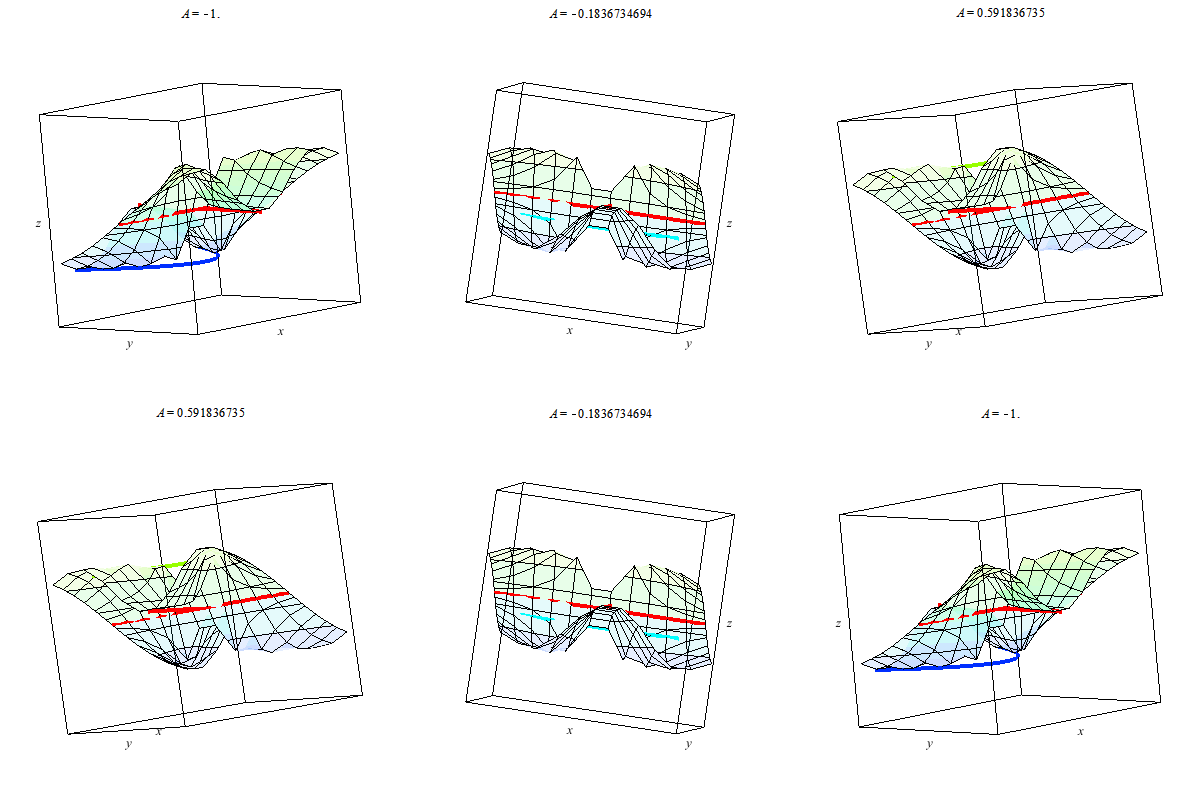
The graph below is of a standard example for the study of the multivariate limit. In particular, the plot z=f(x,y) is a little tricky at (0,0). The colored line indicates the limit of g(t) formed by composing f with a linear path through (0,0). I use color to indicate the value of this linear path as it passes through (0,0). You can see that the values for differing linear paths differs hence the limit at the origin for f(x,y) does not exist. I study the algebraic details in the lecture notes and several still frames of this animation are found in my notes
The graph below is of another standard example for the study of the multivariate limit. In particular, the plot z=f(x,y) is a little tricky at (0,0). The colored line indicates the limit of g(t) as t --> 0 where g is formed by composing f with a linear path through (0,0). I use color to indicate the value of this linear path as it passes through (0,0). You can see that the values for differing linear paths all agree since they cut through the origin. It would seem that f(x,y) --> 0 as (x,y) --> (0,0). However, this is false.
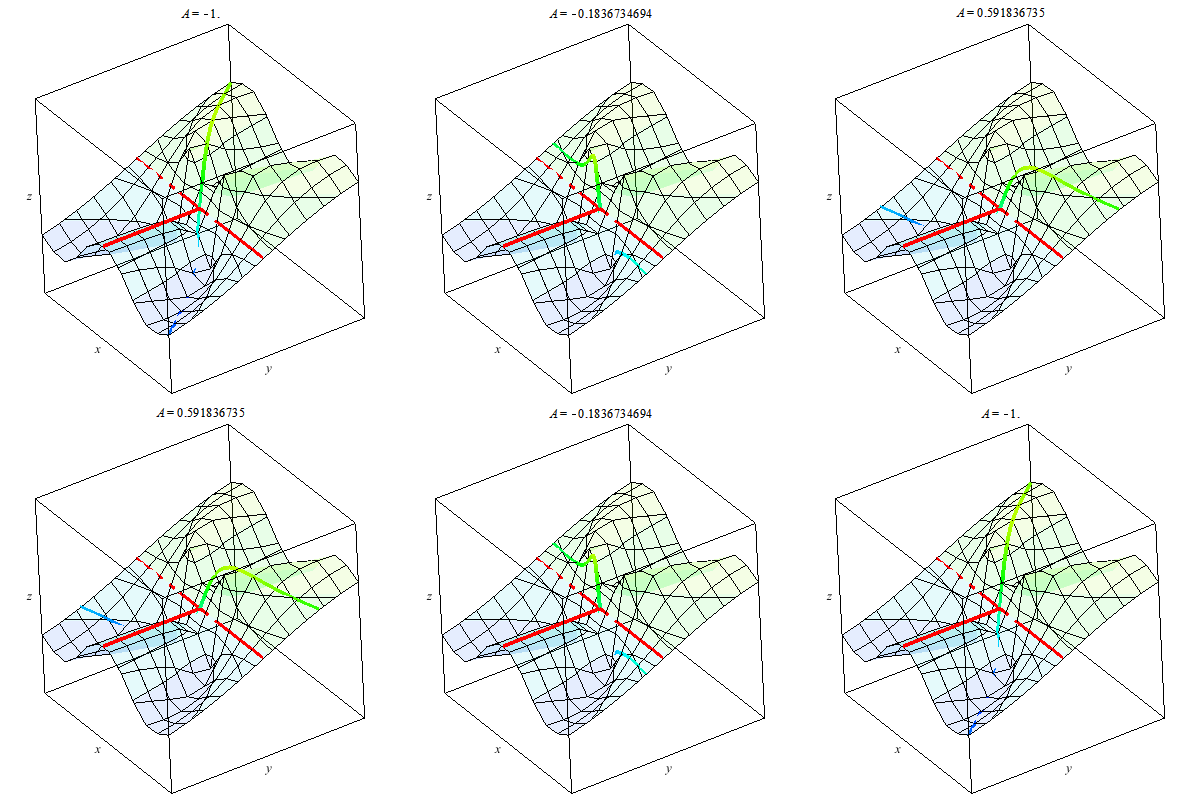
Why? Why does the animation above not prove the limit exists. We consider parabolic paths through the origin then we find a different story. Once more the color of the path indicates the z-value. Clearly diffing parabolic paths lead to different values at we approach the origin. Therefore, the limit of f(x,y) does not exist as (x,y) --> (0,0).
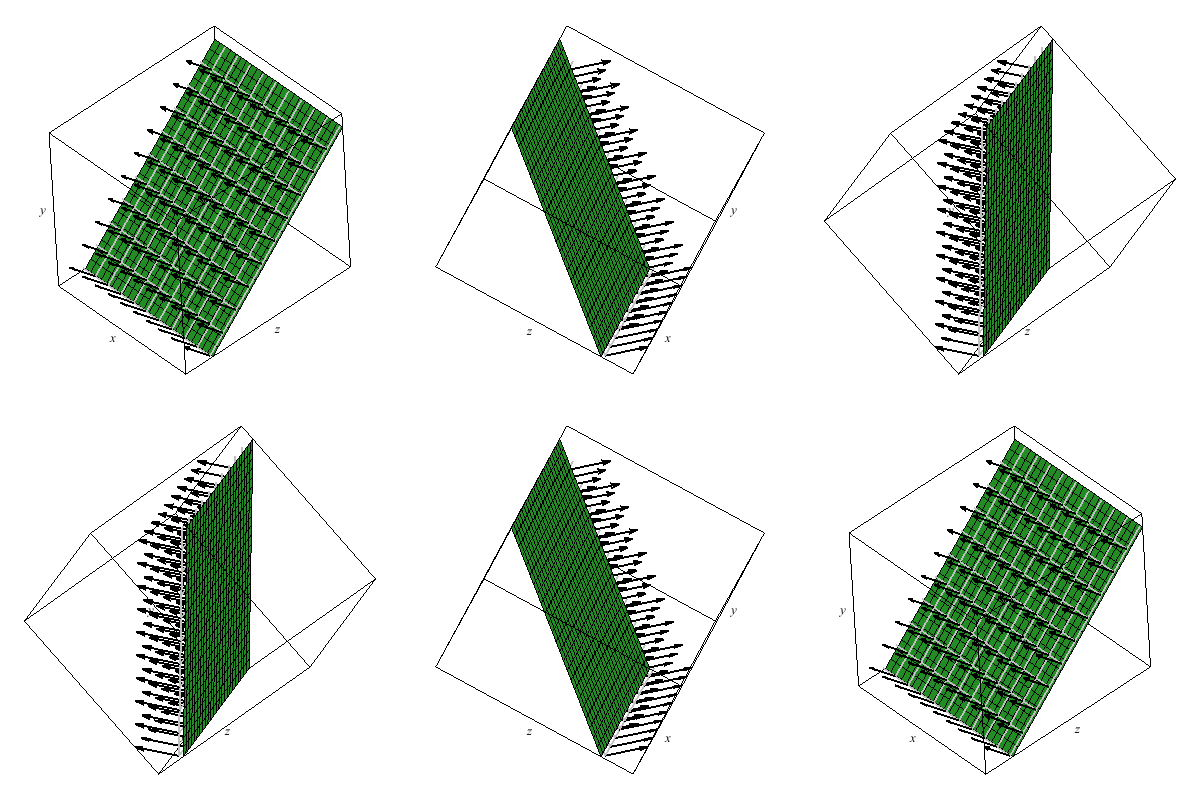
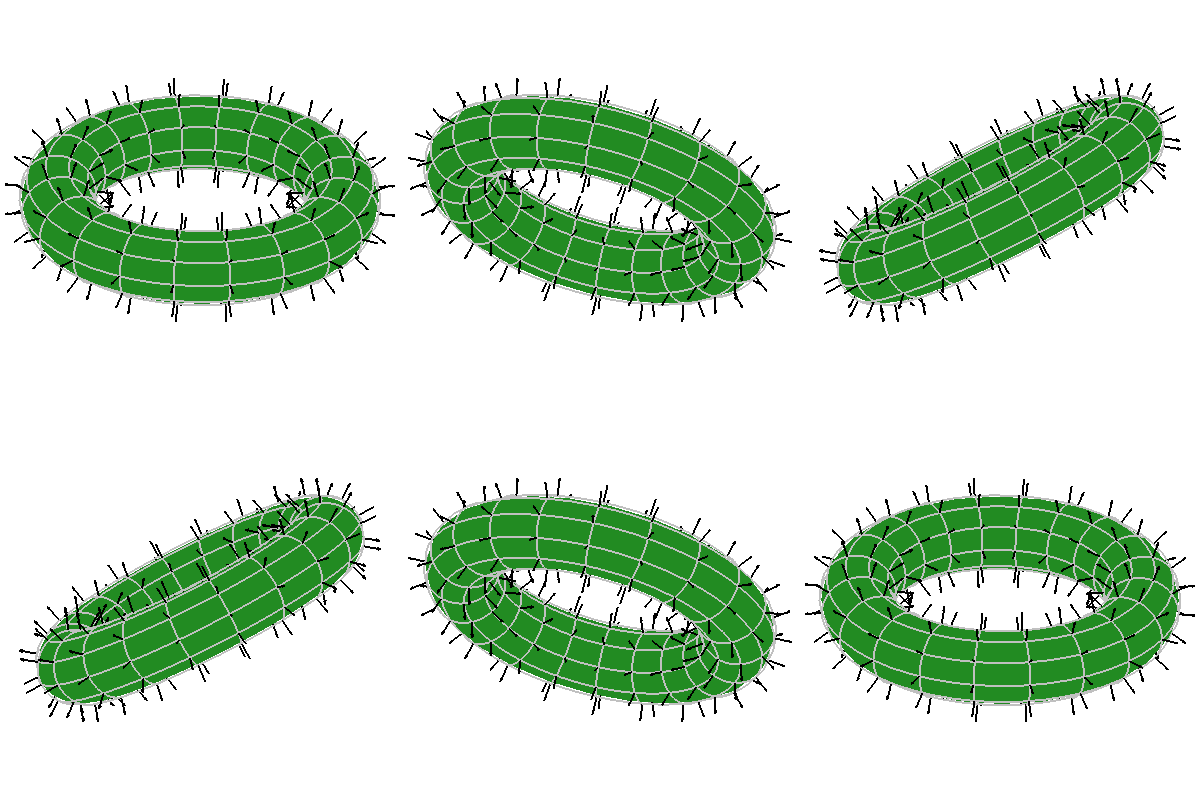
The animations below show the normal vector fields in black as the point out of the surface.
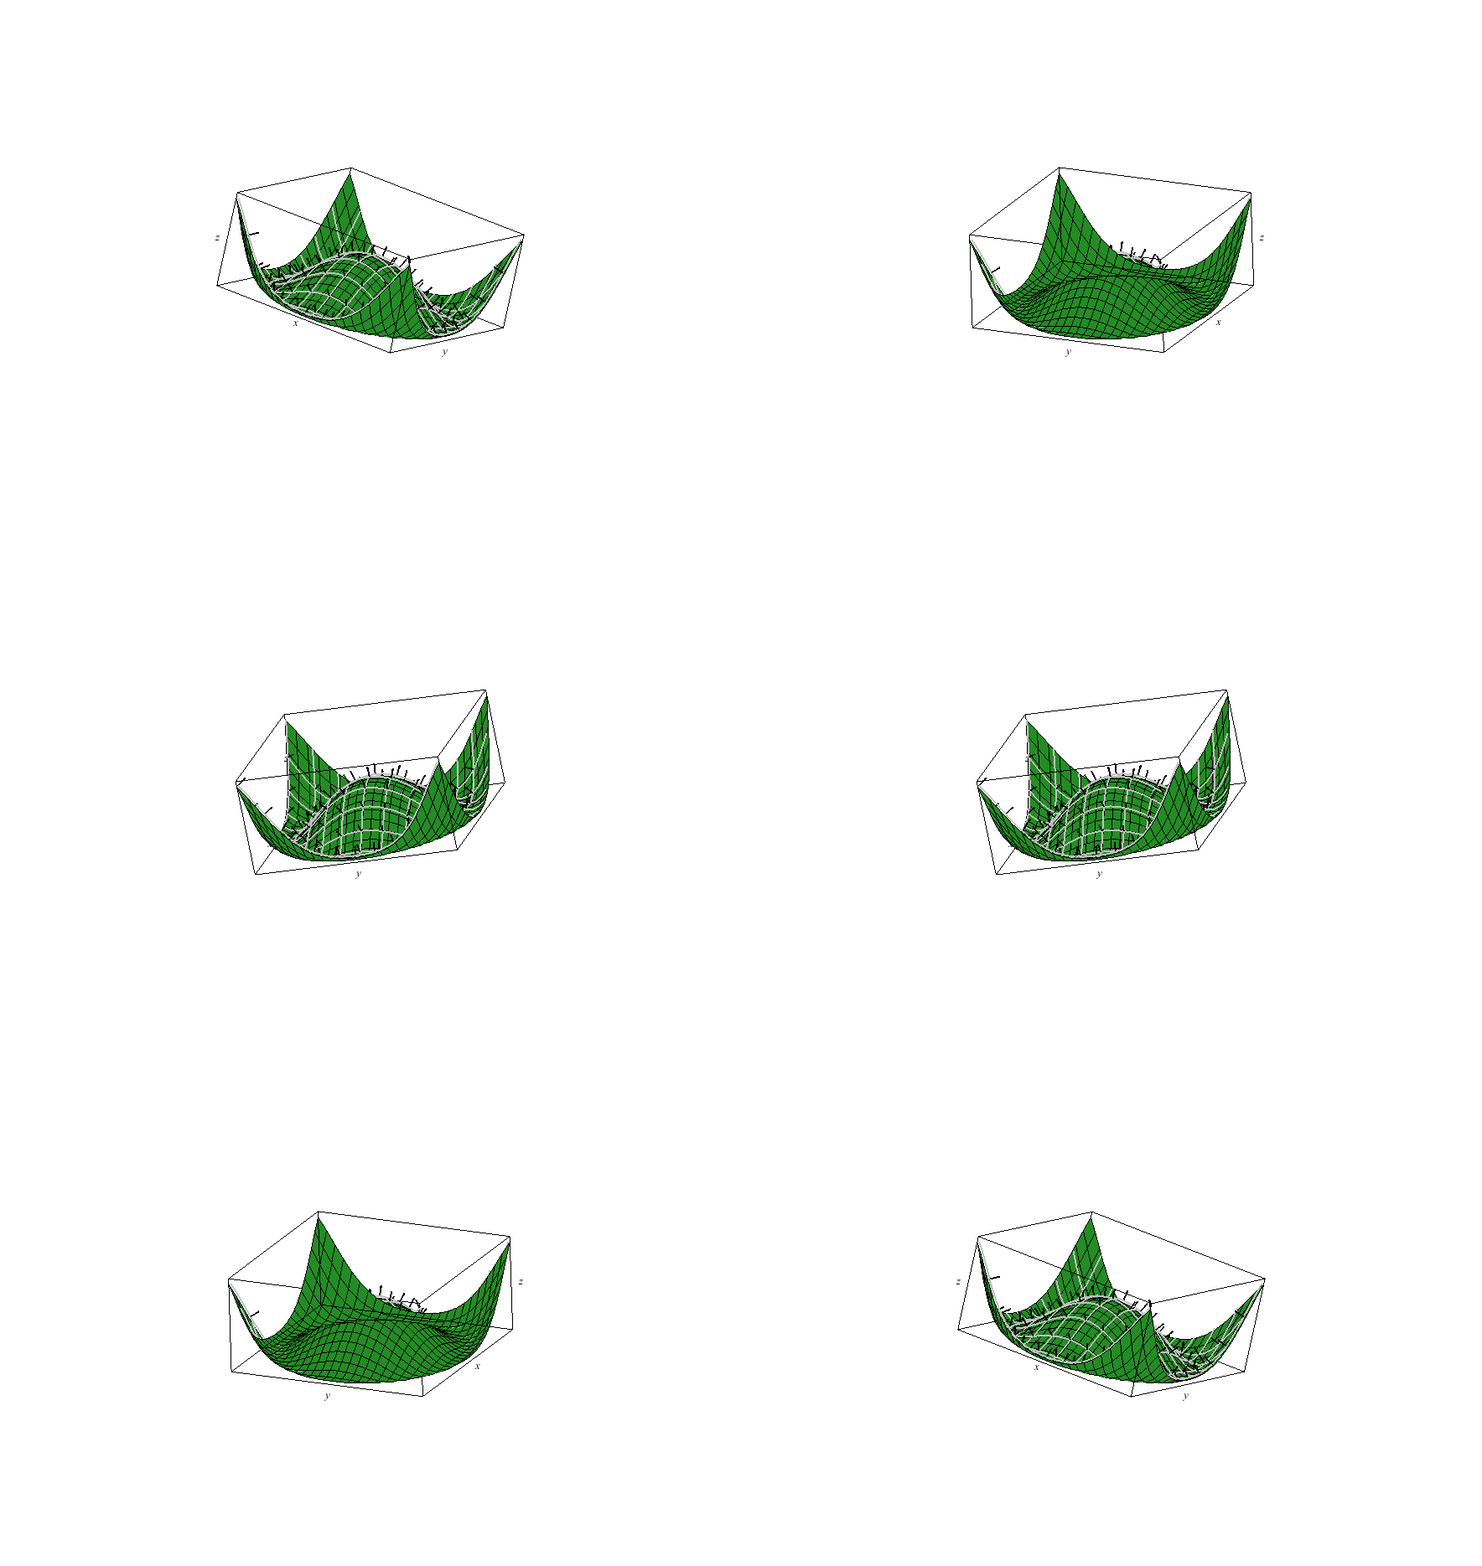
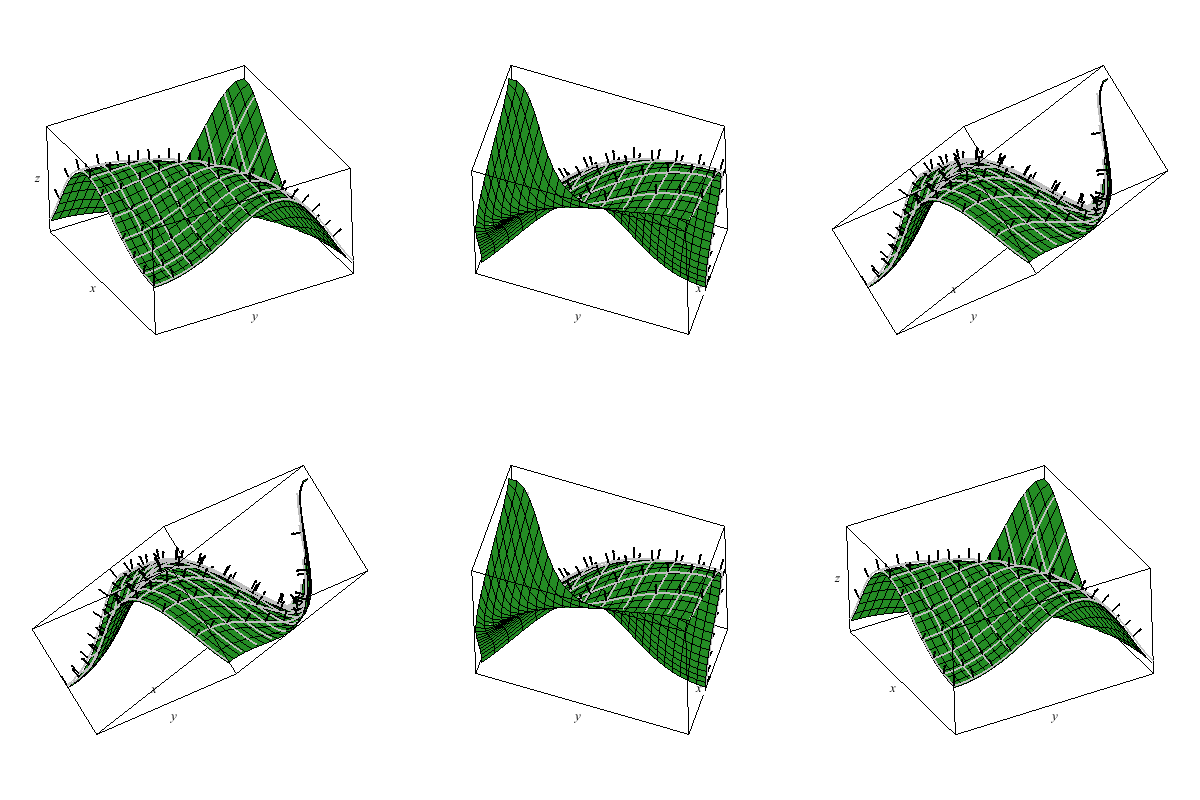
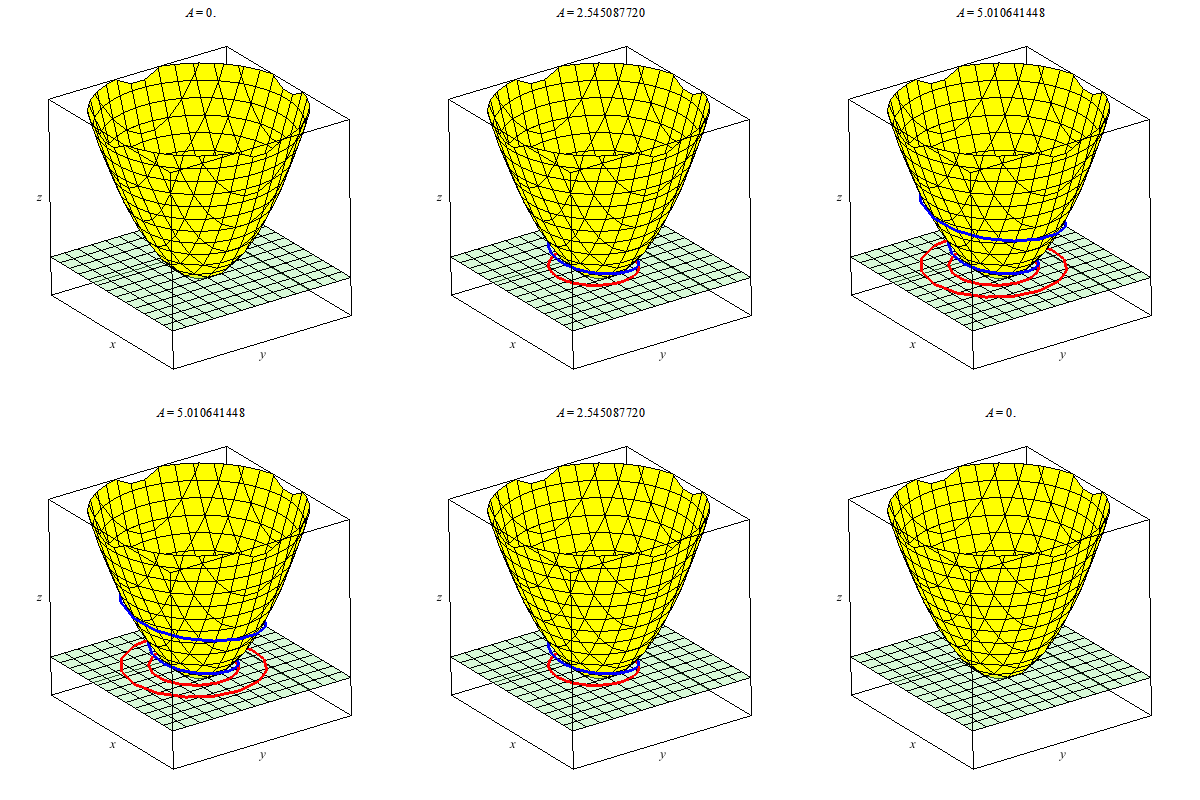
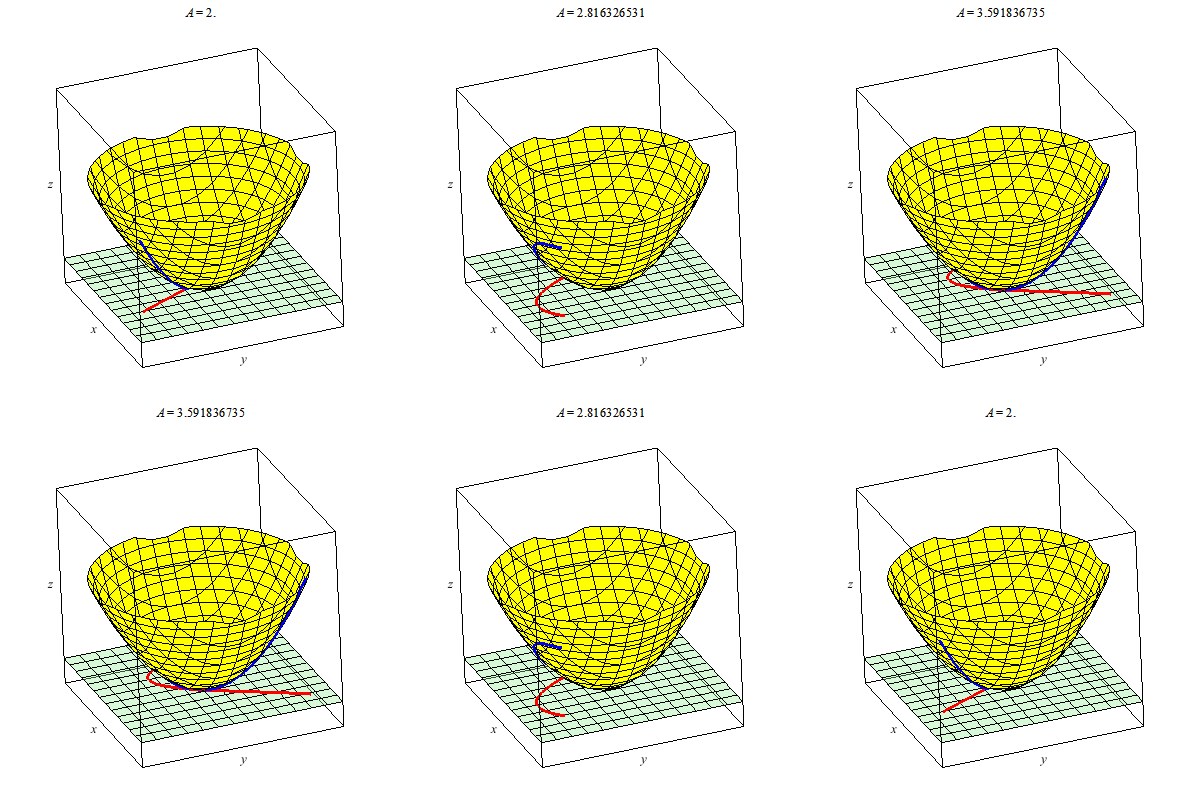
Here I plot a curve in the plane say t --> (x(t),y(t)) and then I also plot the composite of the planar curve with a function f(x,y) to give a z-component of a the curve
t --> (x(t),y(t),f(x(t),y(t))). The idea of feeding an interesting planar curve into a graph or parametrization in three space allows us to create many interesting examples.
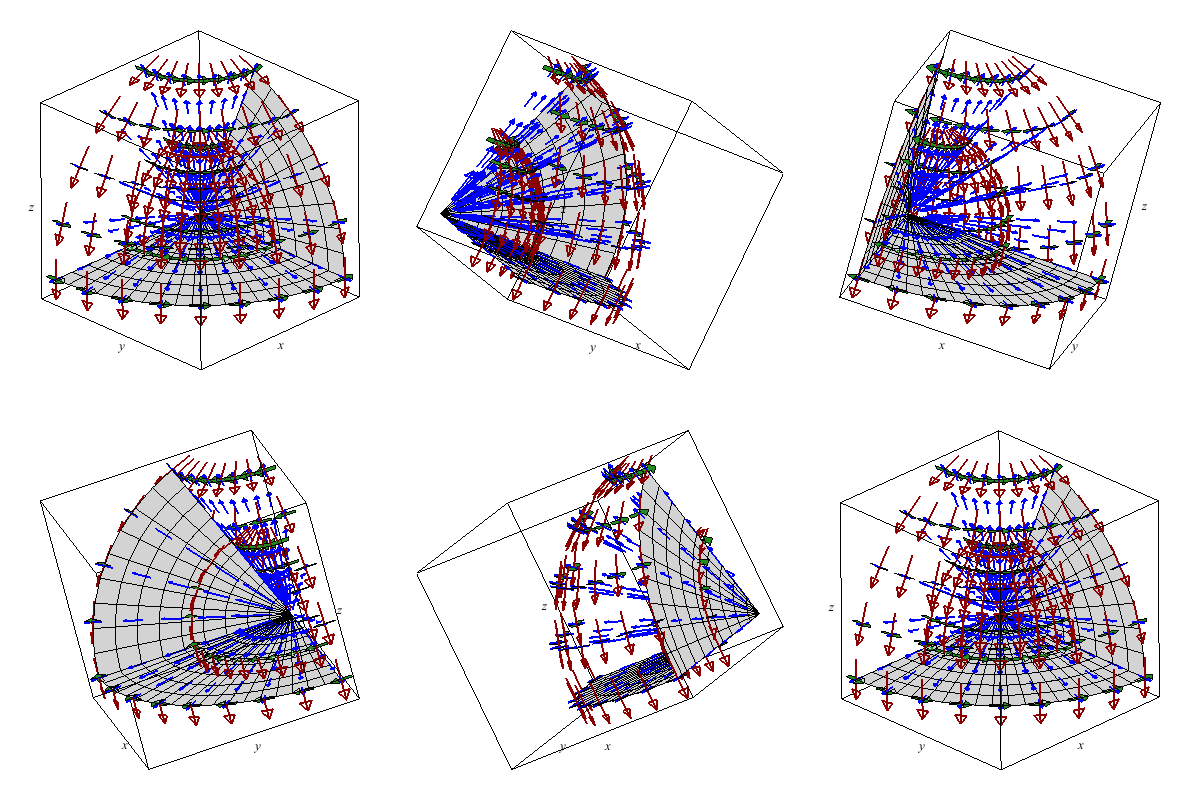
The unit vectors with respect to spherical coordinates generate a rather neat vector field which I'd rather not plot by hand.
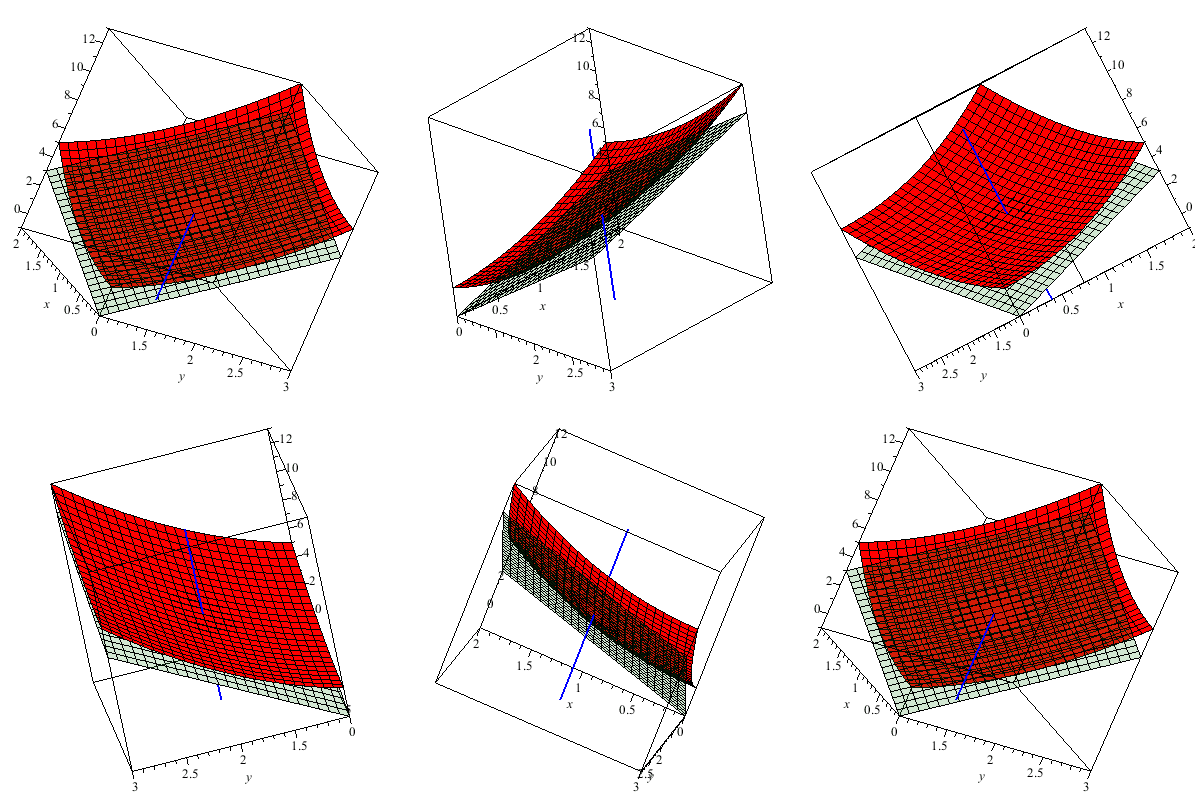
Below I plot the tangent plane to a paraboloid.
This is a level surface with four holes.
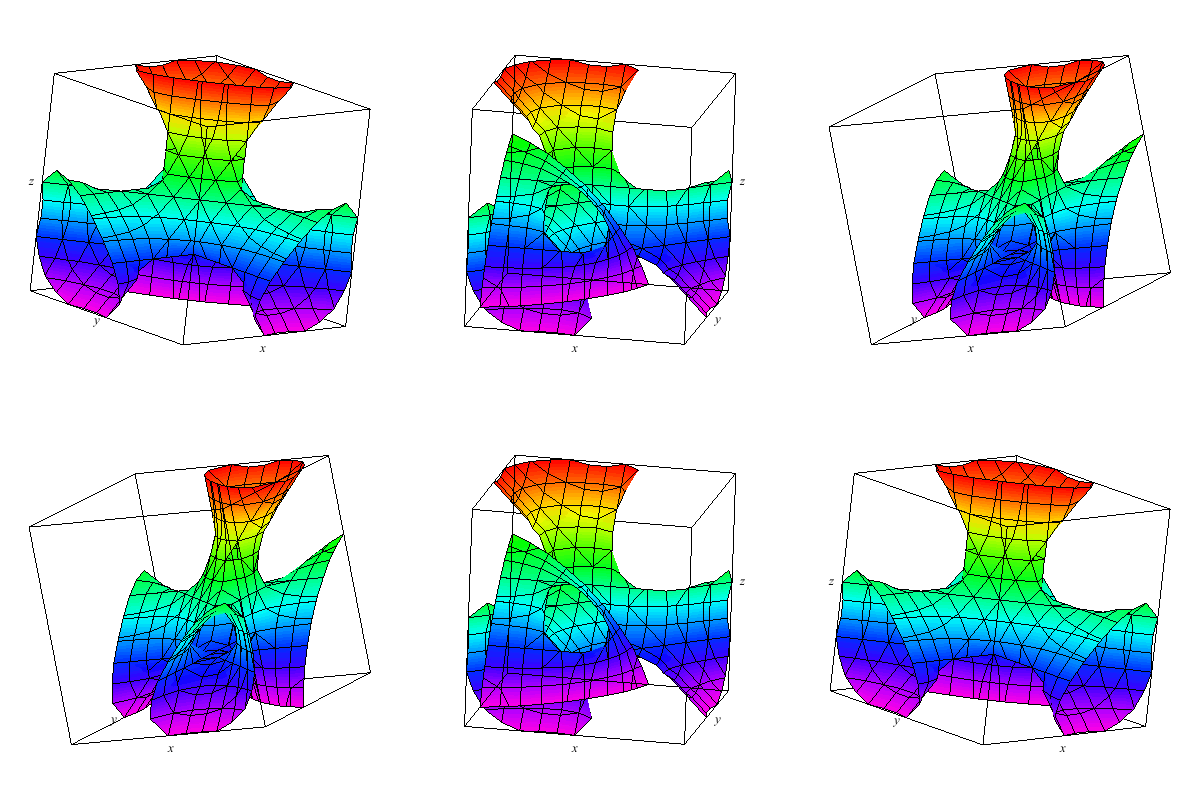
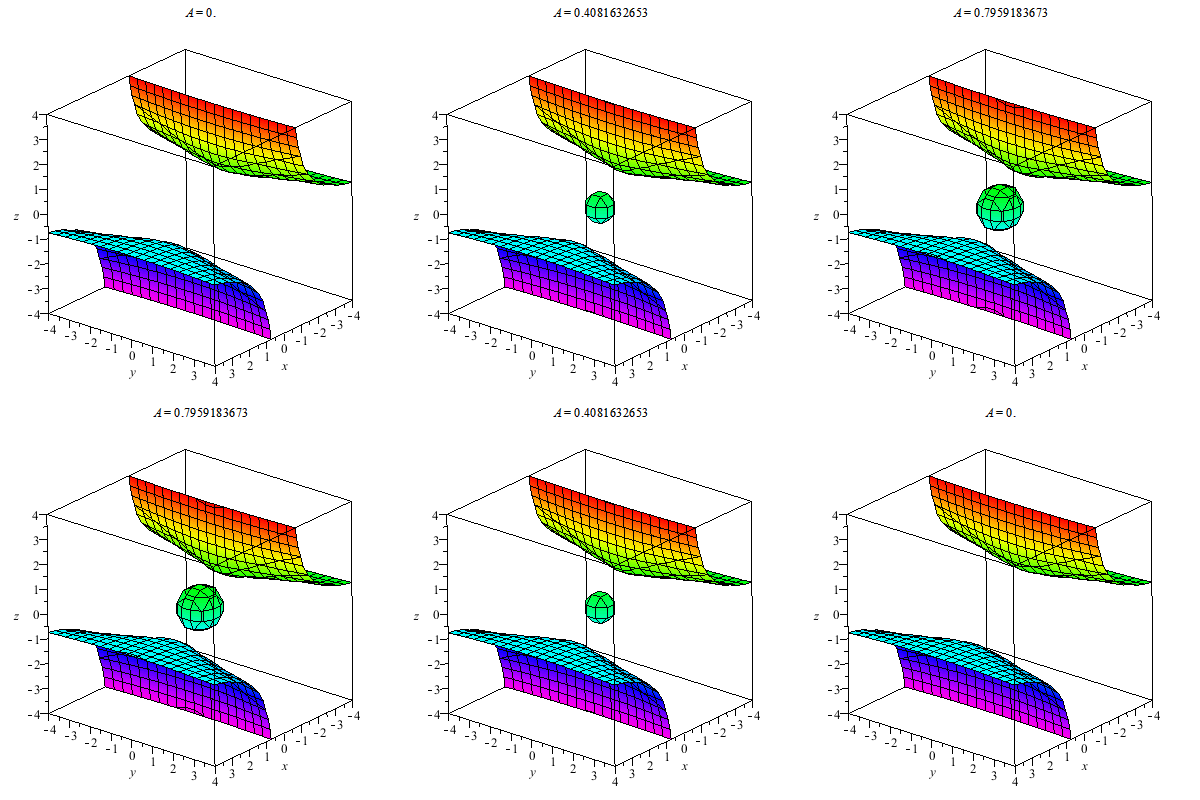
I plot a whole family of surfaces. As the A varies we toggle through different graphs which are related. This time the result is a bit more exotic than the basic quadratic surfaces plot. As you can see the graph can be disconnected.
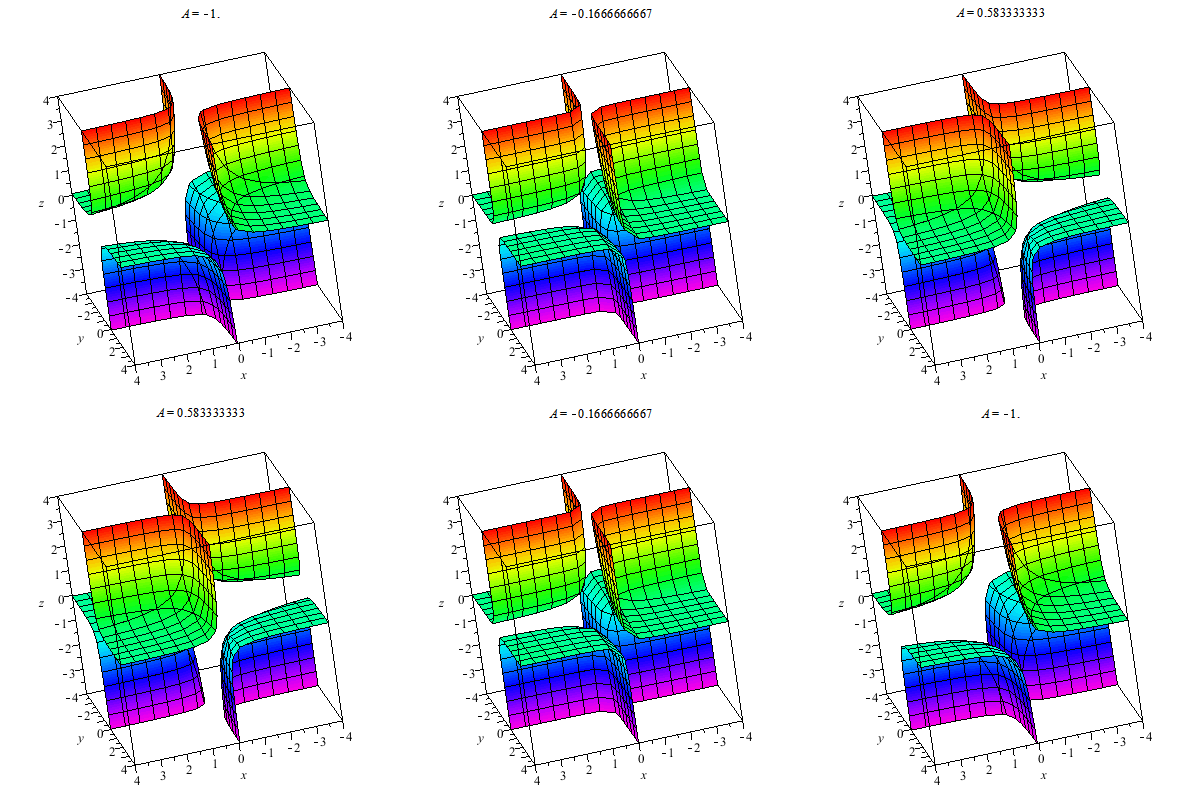
Plotted below are solutions for xyz=A. Notice that A=0 gives the coordinate planes whereas the graphs for A<0 and A>0 are found in differing octants. I have no name for this, in fact, generally it might be interesting to investigate what graphs of the form F(x,y,z)=k for F a trilinear form. You can study the graphs of quadratic forms with the help of linear algebra's diagonalization via e-vectors... Just thinking.
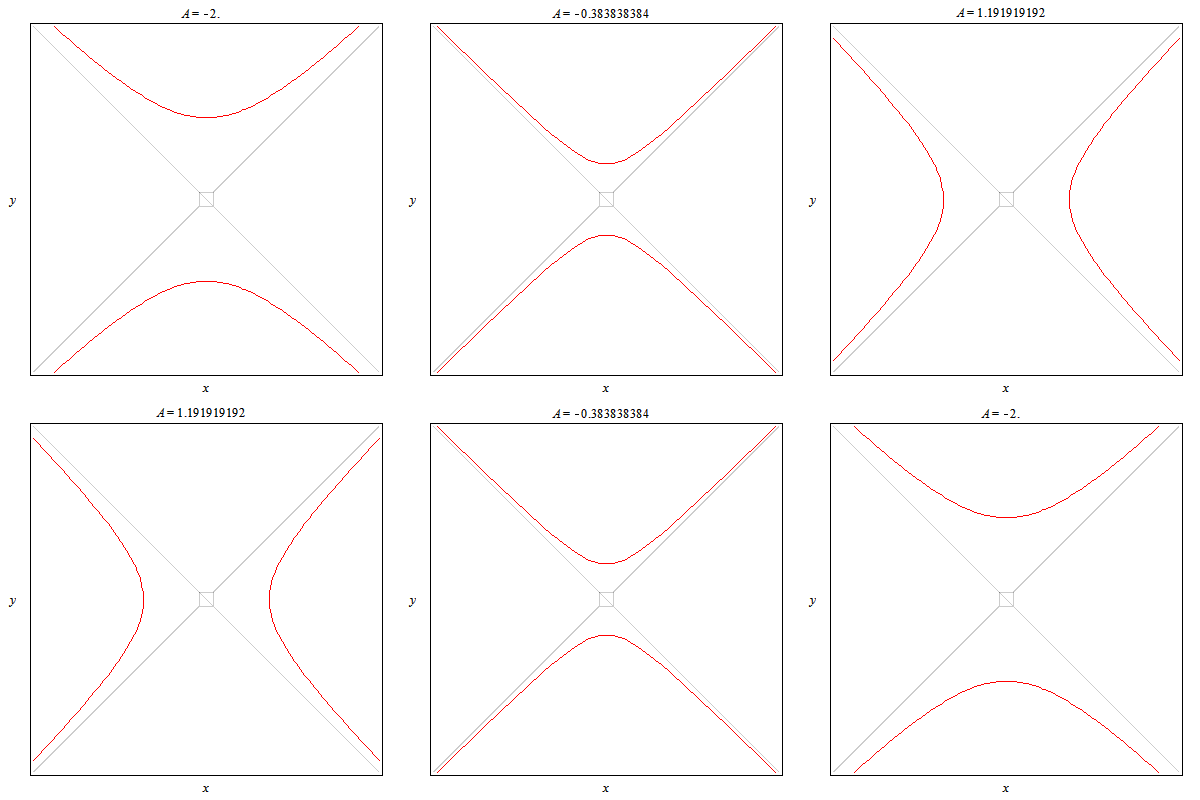
A token 2D animal: This plots hyperbolas opening left/right and up/down. In particular this animation shows all the different cases for yy-xx=A.
Back to my multivariable calculus page
Back to my Home
Last Modified: 8-30-11


